Chart types
The most common types of data visualisations and advice on when and how they can be used.
Comparisons among items
These chart types are used to compare values across different categories.
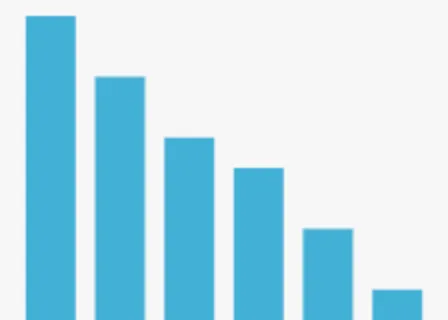
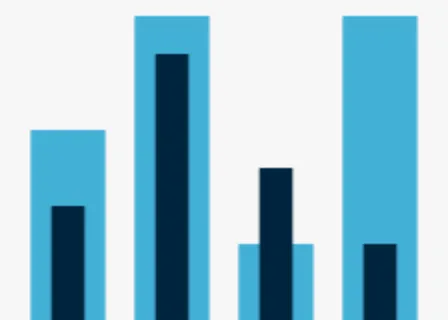
Bar chart (vertical)
Compare the values of different categories. Appropriate for chronological categories.
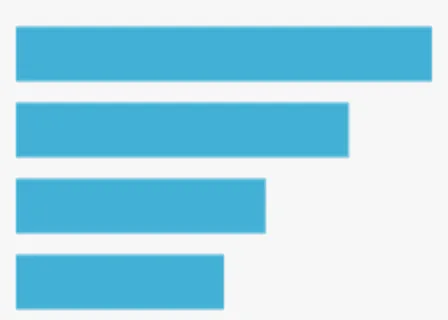
Bar chart (horizontal)
Compare the values of different categories. Appropriate for many categories / long category names.
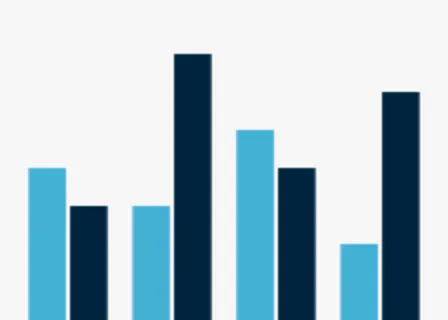
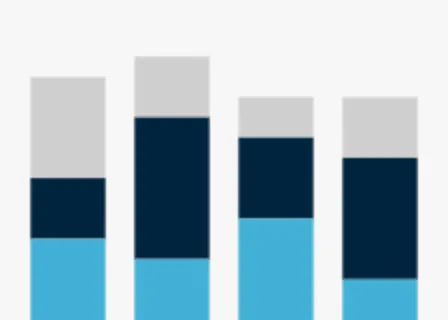
Clustered bar chart
Compare values of multiple category groups.
Bullet chart
Shows how a metric compares with a set goal.
Comparisons over time
These chart types are used to compare changes over time.


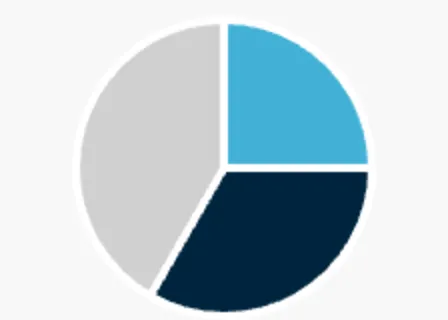
Composition
These chart types are used to show part-to-whole relationships.

Correlation
These chart types are used to depict the distribution of two or more variables.


Performance
These chart types are used to show how metrics are performing.